Batch effects in scRNA velocity analysis
… in which we discuss whether batch effects exists in scRNA velocity data and how to correct it.
First some background.
RNA velocity for scRNA-seq data is an exciting new technique which was introduced by La Manno et al. (2018 Nature) who introduced the “steady-state model” (building on previous work), which was subsequently expanded to the “dynamic model” by Bergen et al (2020 Nature Biotech).
The goal is to predict the future expression state of a cell. The input to this analysis is two gene by cell matrices, one with spliced and one with unspliced counts, typically referred to as the S and U matrices. For each gene, a phase-plot is constructed which is used to estimate the gene- and cell-specific velocity. The phase-plot is a scatterplot of the relevant row (gene) from the U and S matrices (well, a moment estimator of these quantities, but that is a minor point). In other words, the gene-specific velocities are determined by the relationship of S and U.
The two publications mentioned above only analyzes a single sample (ie. many cells from one sample). In gene expression analysis – including analysis of scRNA-seq data – we expect the presence of batch effects or “unwanted variation” between samples processed in different batches, see Leek et al (2010 Nature Rev Genet) for a review. This raises the question of whether batch effects exists for this type of data.
As someone who has worked on batch effects and normalization for a while, my gut reaction to this question is “yes” since I expect batch effects to exists in all high-throughput genomic data. A better question is whether batch effects are big enough to worry about. However, because RNA velocity is estimated by the relationship between S and U, and these two quantities are derived from the same sample, perhaps this serves as a within-sample normalization which alleviates (but probably does not completely remove) a possible batch effect. Indeed, this was our expectation when Charles Zheng, Loyal Goff and I started to look at this type of analysis.
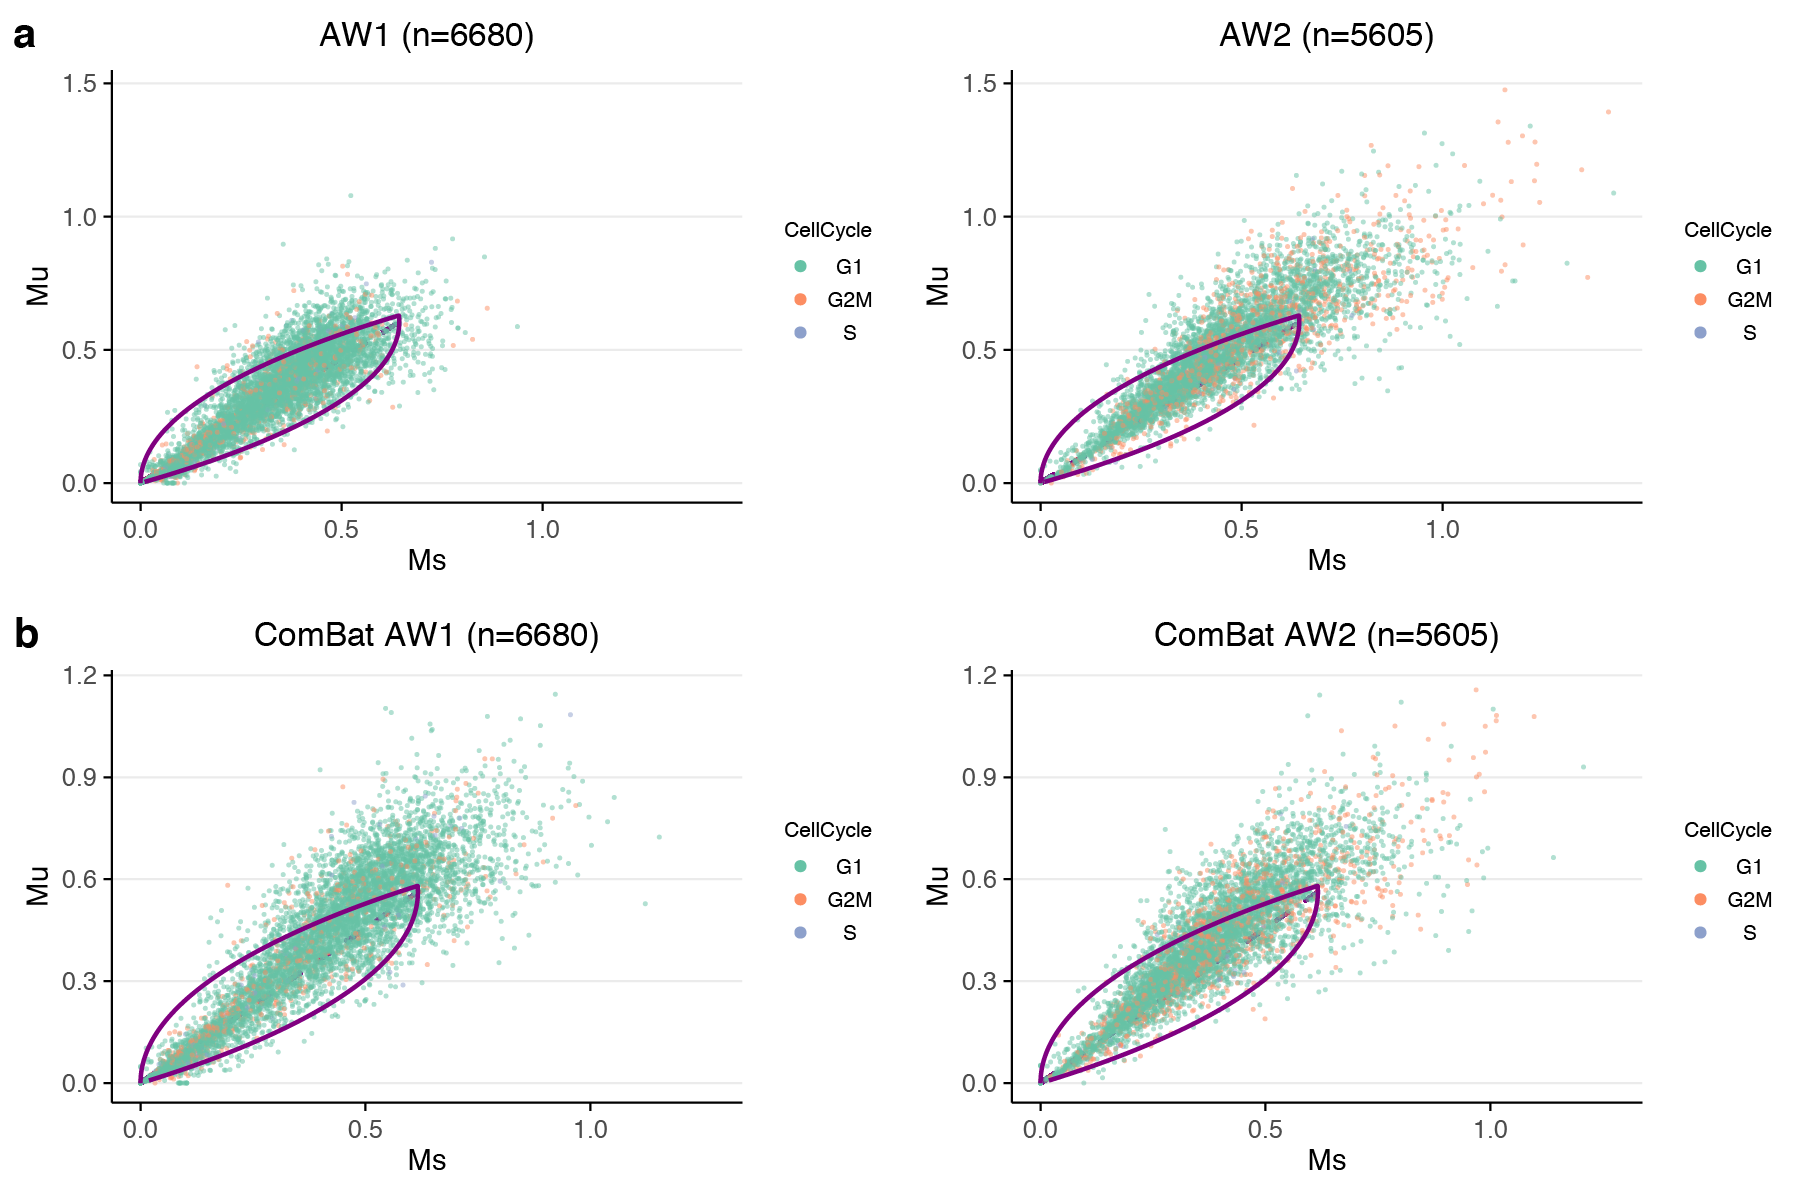
In the figure below we show (first row) data from a single gene and two replicates processed in two different batches. We observe that the cloud of points extends differently in the two replicates. This difference introduces a batch effect in the velocity estimation, contrary to what might be expected. The skeptical reader will note we are only showing one gene, but take our word for it, it is quite visible across many genes.
This opens the question of how to correct for this batch effect. In (differential) gene expression analysis we have many such methods. But a challenge for RNA velocity is that we need to batch correct not 1 but 2 matrices simultaneously, which is a new problem.
To address this, Charles Zheng came up with the following idea:
- Construct M = S + U, as well as $R = S/(S+U)$. This means we have S = MR and U = M(1-R).
- Batch correct M, for example by using ComBat, to get a corrected matrix Mb (see extended comments below).
- Back transform into corrected matrices Sb, Ub by Sb = Mb * R, Ub = Mb * (1-R)
This assumes that the batch effect operates on the total expression (S+U) and does not affect the ratio. However, it allows us a first attempt at batch correcting the data.
In our experience, this approach works best on log transformed expression measures. Specifically, we correct S and U for library size, and form M=U+S. Then we log transform M as log(M+1), use ComBat and invert the log transformation. This is what we feed to scVelo and friends. Note that the sum happens on the original scale.
Furthermore, in our experience, Alevin exhibits less batch effects compared to Kallisto. And transformation-wise, doing ComBat on the log-scale is better than not log transforming. Finally, we found ComBat on the log-scale to be superior to ComBat-seq. We emphasize that this is just our experience based on a couple of datasets. Update I want to emphasize that I don’t fully understand these two observations (Alevin vs. Kallisto and ComBat vs. ComBat-seq), which suggests that this may not hold in general (we do not claim to have looked at this comprehensively) or that we are not looking at this the right way. Nevertheless, I am puzzled by this, which is why I think its worth noting.
Doing this yields the bottom row of the figure, where the two phase plots are now on the same scale.
It’s clear that this is not the last word on correcting for batch effects in RNA velocity, but we have found this to be a good start. Certainly better than doing nothing.
Update (2021/4/14): fixed a typo in the definition of R from R=S/U (wrong) to R=S/(S+U) (correct). Thanks to Cal Gunnarson and Alex Ascension for pointing it out.